Eclipse MicroProfile OpenTracing comes to WildFly
Until WildFly 19 you could use Eclipse MicroProfile OpenTracing (MPOT) to trace your application using environment variables relying on the SmallRye OpenTracing implementation. With WildFly 19 you can now configure several Jaeger Tracers to be used in your applications.
Installing Jaeger
Let’s start a jaeger instance using docker :
docker run -d --name jaeger \
  -p 6831:6831/udp \
  -p 5778:5778 \
  -p 14268:14268 \
  -p 16686:16686 \
  jaegertracing/all-in-one:1.16
Now, you can navigate to http://localhost:16686 to access the Jaeger UI.
Configuring the OpenTracing subsystem
You can use either UDP or TCP to send your log spans to Jaeger. Note that those configurations are exclusive, so if you configure a TCP endpoint then Jaeger won’t use the UDP configuration.
Using UDP
First we use the WildFly CLI tool to define an outbound socket binding towards the Jaeger tracer.
[standalone@localhost:9990 /] /socket-binding-group=standard-sockets/remote-destination-outbound-socket-binding=jaeger:add(host=localhost, port=6831)
{"outcome" => "success"}
Now we can define our MPOT tracer configuration:
[standalone@localhost:9990 /] /subsystem=microprofile-opentracing-smallrye/jaeger-tracer=jaeger-demo:add(sampler-type=const, sampler-param=1, reporter-log-spans=true, sender-binding=jaeger)
{"outcome" => "success"}
Using TCP
If you want to use TCP instead of UDP you need to configure the sender-endpoint and set its value to http://localhost:14268/api/traces.
[standalone@localhost:9990 /] /subsystem=microprofile-opentracing-smallrye/jaeger-tracer=jaeger-demo:write-attribute(name="sender-endpoint", value="http://localhost:14268/api/traces")
{
    "outcome" => "success",
    "response-headers" => {
        "operation-requires-reload" => true,
        "process-state" => "reload-required"
    }
}
[standalone@localhost:9990 /] reload
Setting the default tracer
Let’s define this new tracer as the default tracer to be used by WildFly:
[standalone@localhost:9990 /] /subsystem=microprofile-opentracing-smallrye:write-attribute(name=default-tracer, value=jaeger-demo)
{
    "outcome" => "success",
    "response-headers" => {
        "operation-requires-reload" => true,
        "process-state" => "reload-required"
    }
}
[standalone@localhost:9990 /] reload|
Note
|
Instead of relying on the default tracer attribute, you can use the web.xml deployment descriptor and set the init-parameter smallrye.opentracing.tracer.configuration to the name of the tracer to use. |
Deploying a demo application
We provide a sample application at https://github.com/ehsavoie/opentracing-demo. This application is a simple JAXRS endpoint producing XML or JSON and failing randomly.
git clone git@github.com:ehsavoie/opentracing-demo.git
cd opentracing-demo
mvn clean install
cp target/opentracing-demo.war $WILDFLY_HOME/standalone/deployments
$WILDFLY_HOME/bin/standalone.sh
Now, you can navigate to http://localhost:8080/opentracing-demo to access the deployed application. Generate a few traces by clicking on the links several times. Note that in order to demonstrate error traces the application deliberately throws exceptions randomly, so don’t be surprised if some requests fail.
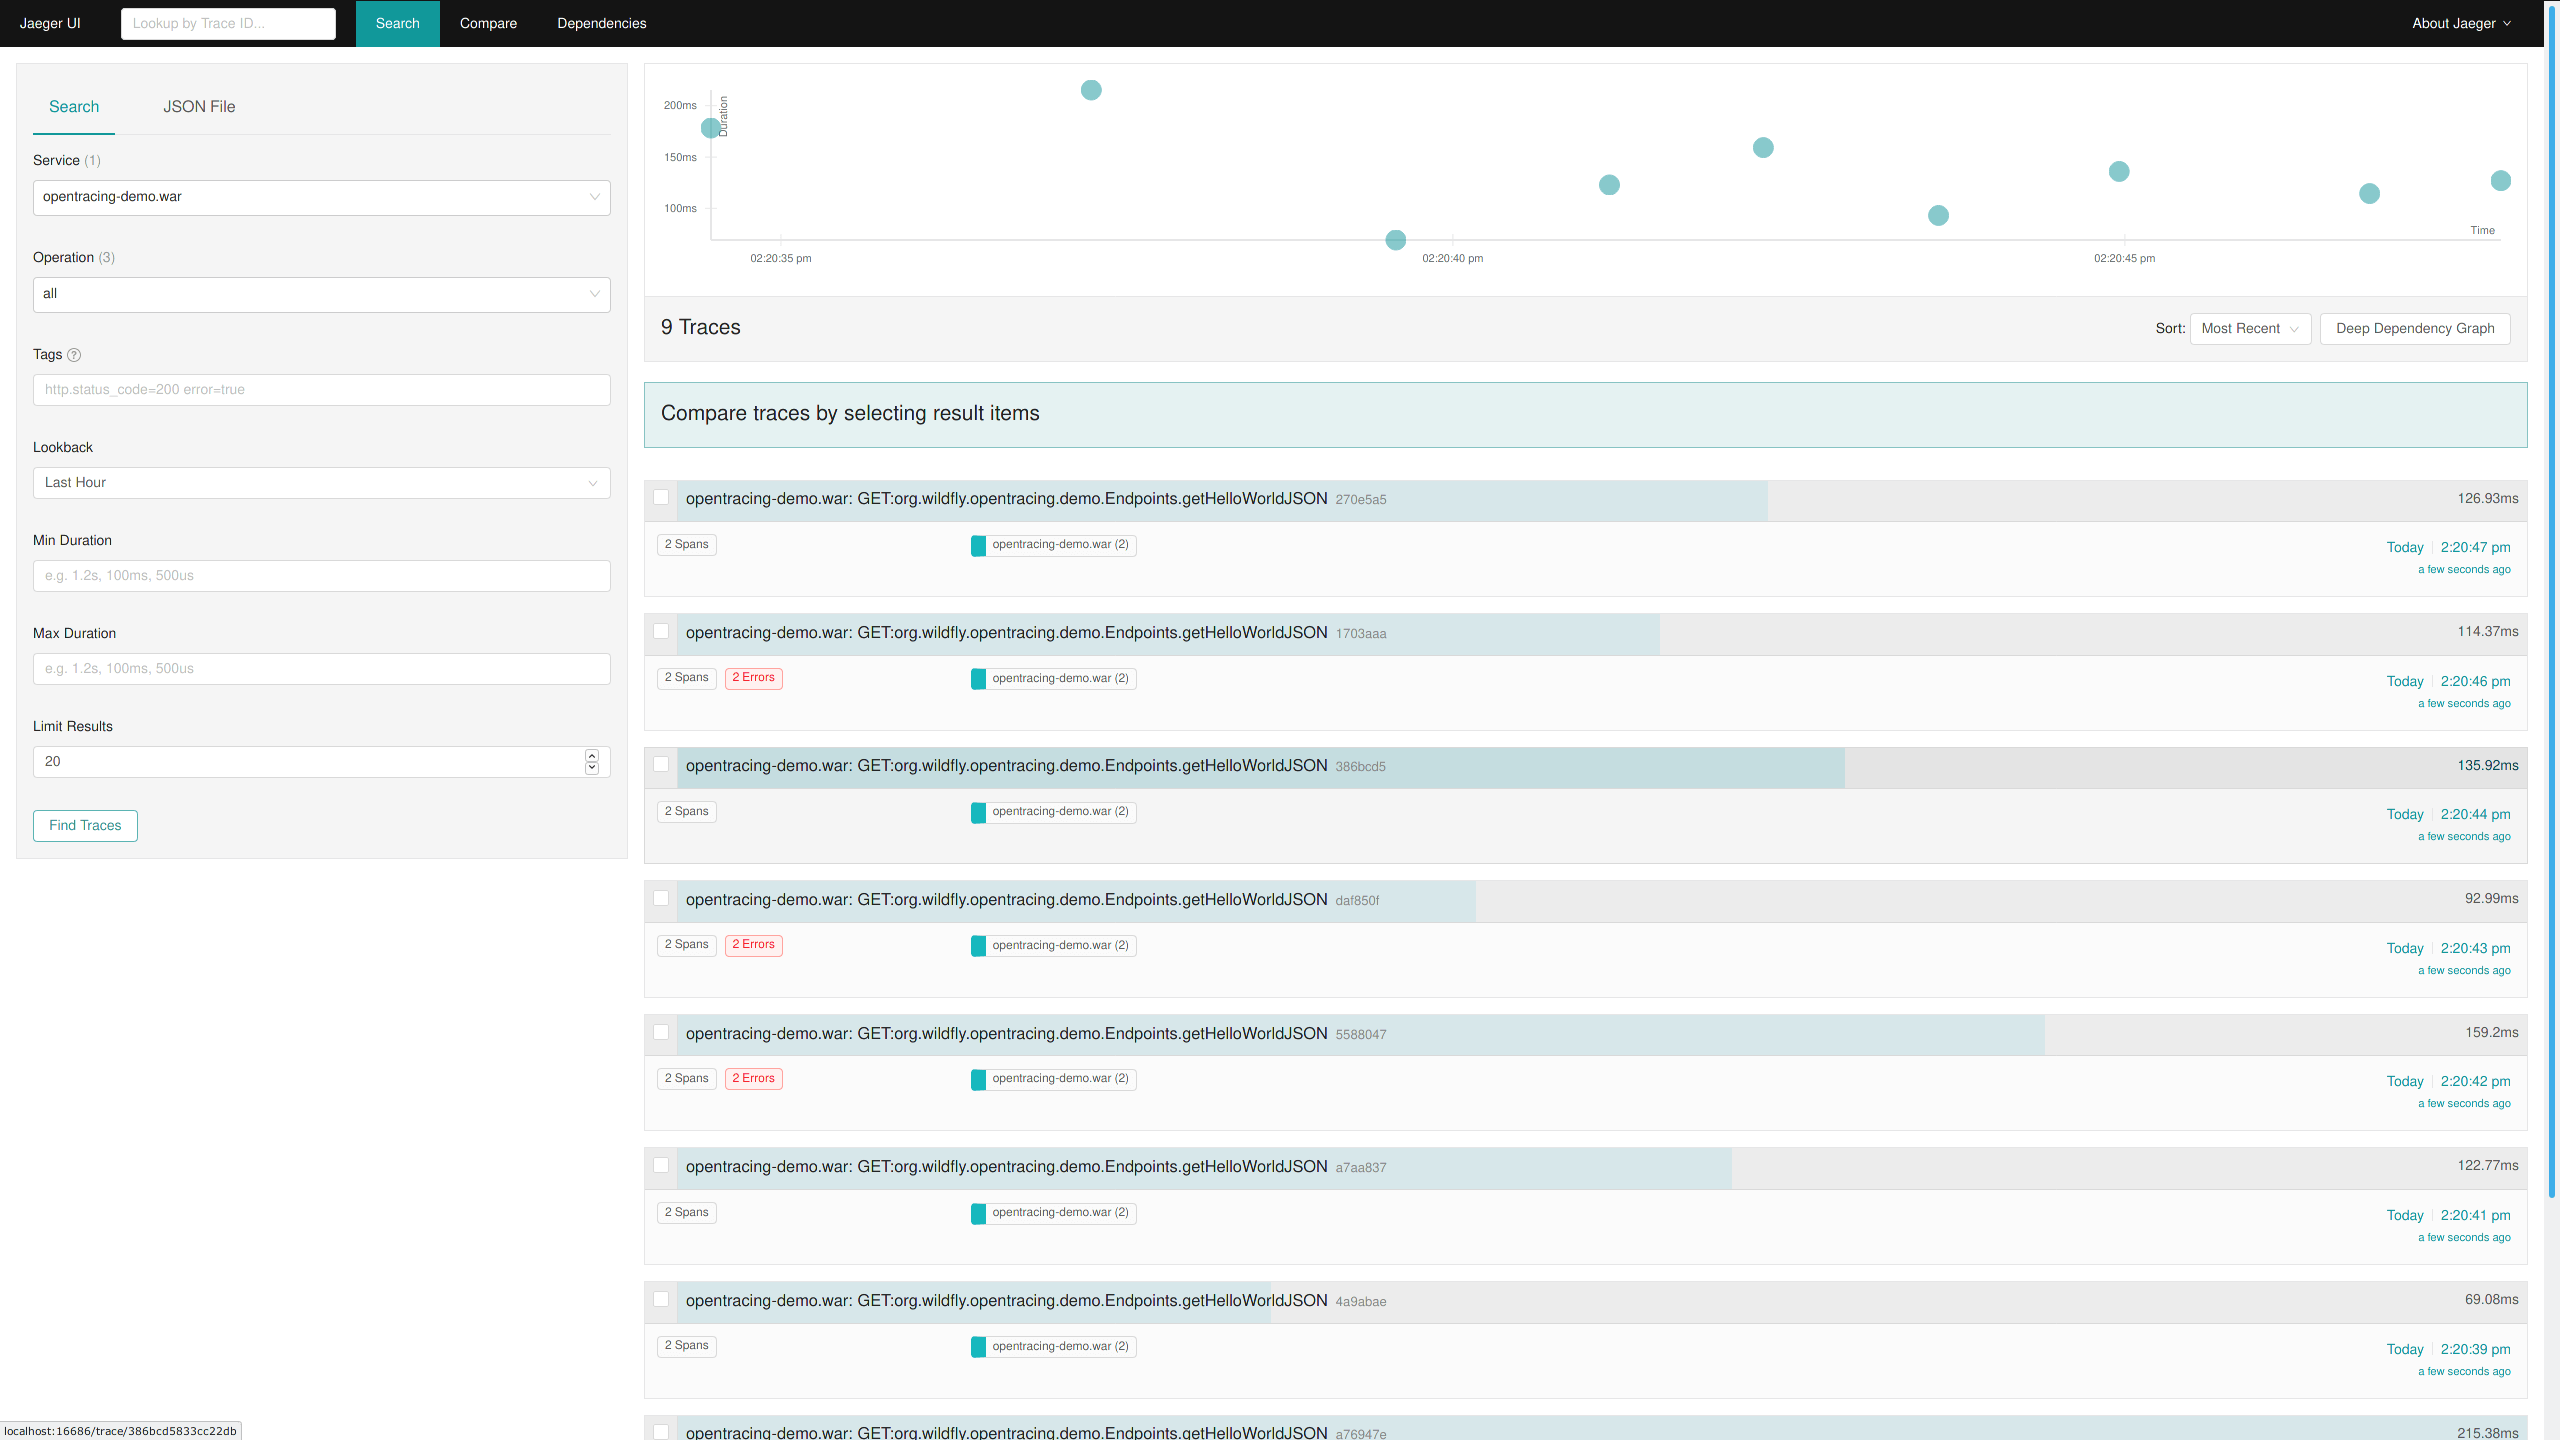
Now open the Jaeger UI and search for traces related to the service opentracing-demo.war, you should see the result of your previous actions.

References
-
WildFly Microprofile OpenTracing configuration: Admin Guide
-
WildScribe: https://docs.wildfly.org/19/wildscribe/subsystem/microprofile-opentracing-smallrye/jaeger-tracer/index.html
-
Eclipse MicroProfile OpenTracing: https://github.com/eclipse/microprofile-opentracing
-
Smallrye Opentracing: https://github.com/smallrye/smallrye-opentracing
-
Jaeger: https://www.jaegertracing.io/
